What Success looks like for an Experimentation program
KPI for growth operation or product operation or experimentation
What is an experimentation program
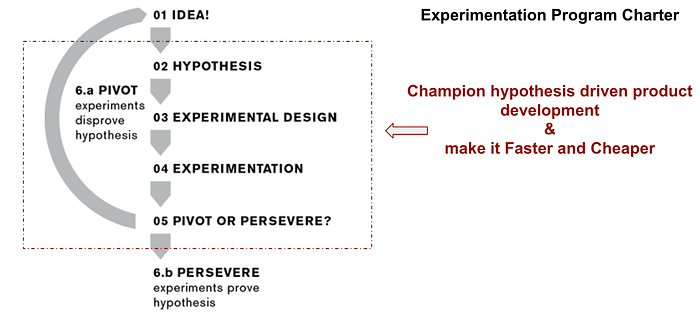
It may have a different meaning to you depending on the companies you have worked for. For this piece, the charter of the experimentation team is:
“To convert ideas into a testable hypothesis. Build and enhance tools, infrastructure for quick and cheap hypothesis validation. Champion processes and methodologies to test and quantify the impact of a hypothesis.”

Success Metric for the program
To define success metrics for the program, we’ll break it into components. We’ll see how it aligns with the company’s growth goal. Let’s follow the growth model framework to understand the drivers.
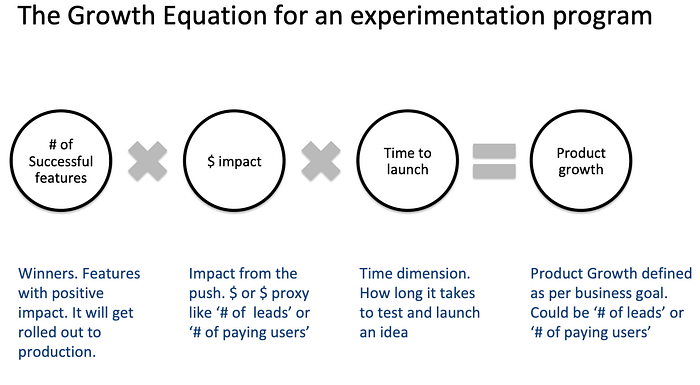
Here is a growth equation for the experimentation program.

Let’s unpack each of these components, and try to understand what drives it.
A. # of successful features
It is nothing but the multiplication of ‘# of features tested’ and ‘win rate.’
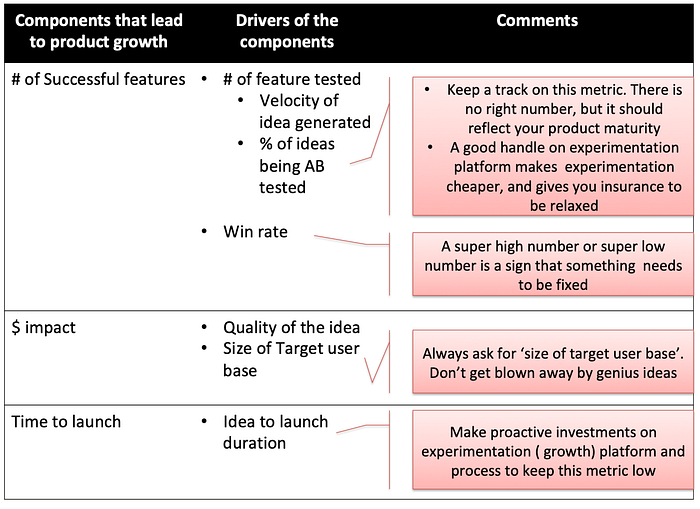
‘# of features tested’ depends on the velocity of ideas generated and % of ideas AB tested.
The velocity of ideas generated: ‘Industry research,’ ‘Consumer research,’’ experience deep dive’ and ‘Metrics deep dive’ are four sources of product ideas. Data and insights generated through experimentation is a great way to learn about users. It helps us in coming up with new ideas. This one is a subset of ‘metrics deep dive.’
Hence ‘velocity of experimentation’ is one of the critical inputs that drive the velocity of ‘ideas generated’. It does because it increases the knowledge base on user behavior.
‘% of ideas being AB tested’ should be the function of experimentation maturity of the organization. It depends on where the product is in the growth curve. If there are not enough users, we’ll not get any real insight out of running experiments. Validating each hypothesis through AB testing is not a good idea for a product undergoing exponential growth. It slows down the rate of pushing features to address consumer needs. If conducting experimentation is fast and cheap, no harm going crazy with experimentation.
Win rate: It is a proxy of the quality of the idea. The more we know about our users, the more accurate we are in predicting the need of the users. Experimentation is one of the ways to know more about users. So, the velocity of experimentation is one of the inputs that help maintains a sound win rate.
Focusing on the win rate is like focusing on the outcome, and it is always wise to focus on the process than the outcome. We may kill a lot of good ideas that don’t sound good on the surface. Y-combinator might not have funded Airbnb if their sole focus was win rate on all the investments. Admittedly an extreme example.
The best strategy would be to focus on the processes and the best practices. We can’t overstate the benefits of clear hypothesis, well-defined success criterion, robust test design, and sound test call out and decision-making framework.
B. $ impact
This input to product growth refers to the size of the idea. It is nothing but the average impact of all successful experiments. The best way to have an impact here is to be more prudent about what we are prioritizing. The estimated impact from an experiment should be one of the inputs for prioritization. We can break it into three components.

Please make a note of the second factor — the size of the user base it serves. You will be surprised to find out how often teams overlook it when it comes to genius looking ideas that make them sound smarter.
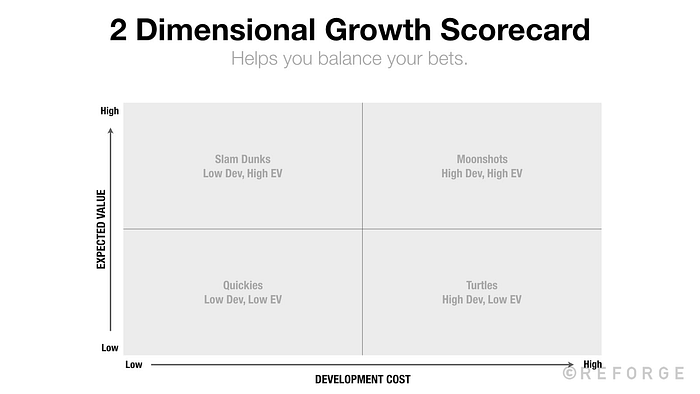
We need to make sure that the team is not only focussed on quickies, but we must have a good representation from ‘Slam dunks’ and MVP ‘Moonshots.’ Here is a growth scorecard from reforge to anchor the conversation.

Getting back to experimentation program KPI! Increase in experimentation velocity increases our data on user behavior. It increases the probability that the team would come up with ‘Slam Dunks’ and ‘Moonshots.’ But, the increased velocity keeps team busy with ‘quickies’. They may miss the slam dunks because of cognitive load on the team.
Experimentation velocity will continue to have a positive correlation with ‘$ impact’ for high experimentation velocity when the growth operation is impeccable.
C. Time to launch
It is input to our product growth for sure. We want to keep the number as low as possible without impacting the quality of the decisions. The way to have a handle on this metric is to ‘build’ stuffs faster, and make ‘data-driven decision’ faster.
- Build stuff faster: Build and Enhance experimentation platform that gives the flexibility to launch experiments without engineering effort or with minimal engineering effort. Build a platform in a way that makes the product component and user segment configurable.
- Faster decision making: We need to have a sophisticated ‘growth monitoring tool’ in place. We need to have a decision-making framework in place that guides people in making high-quality decision consistently in the shortest time possible.
Summary
The three most important KPI any experimentation program/growth operation should look to track is:
- Velocity: # of features tested
- Win rate: Keep a track on win rate, if it is falling too low ( < 10%, review the growth operation and process. If it is too high (>50%), start challenging the team to be more innovative
- Keep track of the distribution of Quickies, slam-dunks, and moonshots. Make sure we have a healthy share of slam-dunks and moonshots.
Let me slide in the 4th equally important metric as well. It is like adding one additional feature just before the sprint.
- Keep track of ‘idea to launch’ duration. Make proactive investments on platform enhancement and processes to take it as low as humanly possible.
Here is an infographic summarizing the piece

